Tempo
Tempo is a distributed tracing backend which allows you to store traces emitted by your applications. A direct integration into Grafana allows to query and search for specific traces.
Details
For customers who want to use distributed tracing in their applications, we provide Tempo as a storage backend. Application code can be instrumented by using the OpenTelemetry framework. Traces can be sent via gRPC or HTTPS to the deployed Tempo instance. All stored traces/spans can then be queried with the help of a deployed Grafana instance.
Architecture


Availability
Tempo is available as an optional service and can be deployed using Cockpit. It can be used to store traces sent by applications which are running on Nine Kubernetes Engine (NKE) or are deployed externally.
When deploying a nine managed Grafana instance, a corresponding Tempo data source will be automatically configured in it. It is still possible to query the Tempo instance from an external running Grafana.
Usage
If your application code is not instrumented to emit traces yet, please visit the OpenTelemetry getting started guides, which provide an excellent introduction to the API and SDK for different programming languages. You will need to use an OTLP exporter to send traces to Tempo. The configuration depends on where the application is running.
Sending traces from applications running on NKE
Applications running on NKE can make use of the automatically deployed OpenTelemetry collector. The collector allows to collect all traces before sending them batched to the Tempo instance. Tempo authentication information is injected automatically on the collector.
You only need to configure the OTLP endpoint by pointing it to the collector URL displayed in Cockpit. You can use the predefined OTEL_EXPORTER_OTLP_ENDPOINT environment variable for this.
Sending traces from applications not running on NKE
Applications which are not deployed on a NKE cluster need to send traces directly to the deployed Tempo instance. You can send traces either via gRPC or HTTPS. The Tempo URL can be found in Cockpit. Please make sure to integrate the basic authentication credentials for your Tempo instance which are also shown in Cockpit. Here is an example on how to configure an OTLP gRPC exporter in golang:
package example

import (
	"context"
	"crypto/tls"
	"encoding/base64"
	"fmt"

	"go.opentelemetry.io/otel/exporters/otlp/otlptrace"
	"go.opentelemetry.io/otel/exporters/otlp/otlptrace/otlptracegrpc"
	"google.golang.org/grpc"
	"google.golang.org/grpc/credentials"
)

func grpcExporter(ctx context.Context, username, password, host string) (*otlptrace.Exporter, error) {
	conn, err := grpc.DialContext(
		ctx, fmt.Sprintf("dns:%s", host),
		grpc.WithBlock(),
		// we use a default tls.Config, which enforces TLS verification.
		grpc.WithTransportCredentials(credentials.NewTLS(&tls.Config{})),
	)
	if err != nil {
		return nil, fmt.Errorf("error dialing gRPC: %w", err)
	}

	auth := username + ":" + password
	return otlptracegrpc.New(
		ctx, otlptracegrpc.WithGRPCConn(conn),
		otlptracegrpc.WithHeaders(
			map[string]string{
				"Authorization": "Basic " + base64.StdEncoding.EncodeToString([]byte(auth)),
			},
		),
	)
}
Viewing traces in Grafana
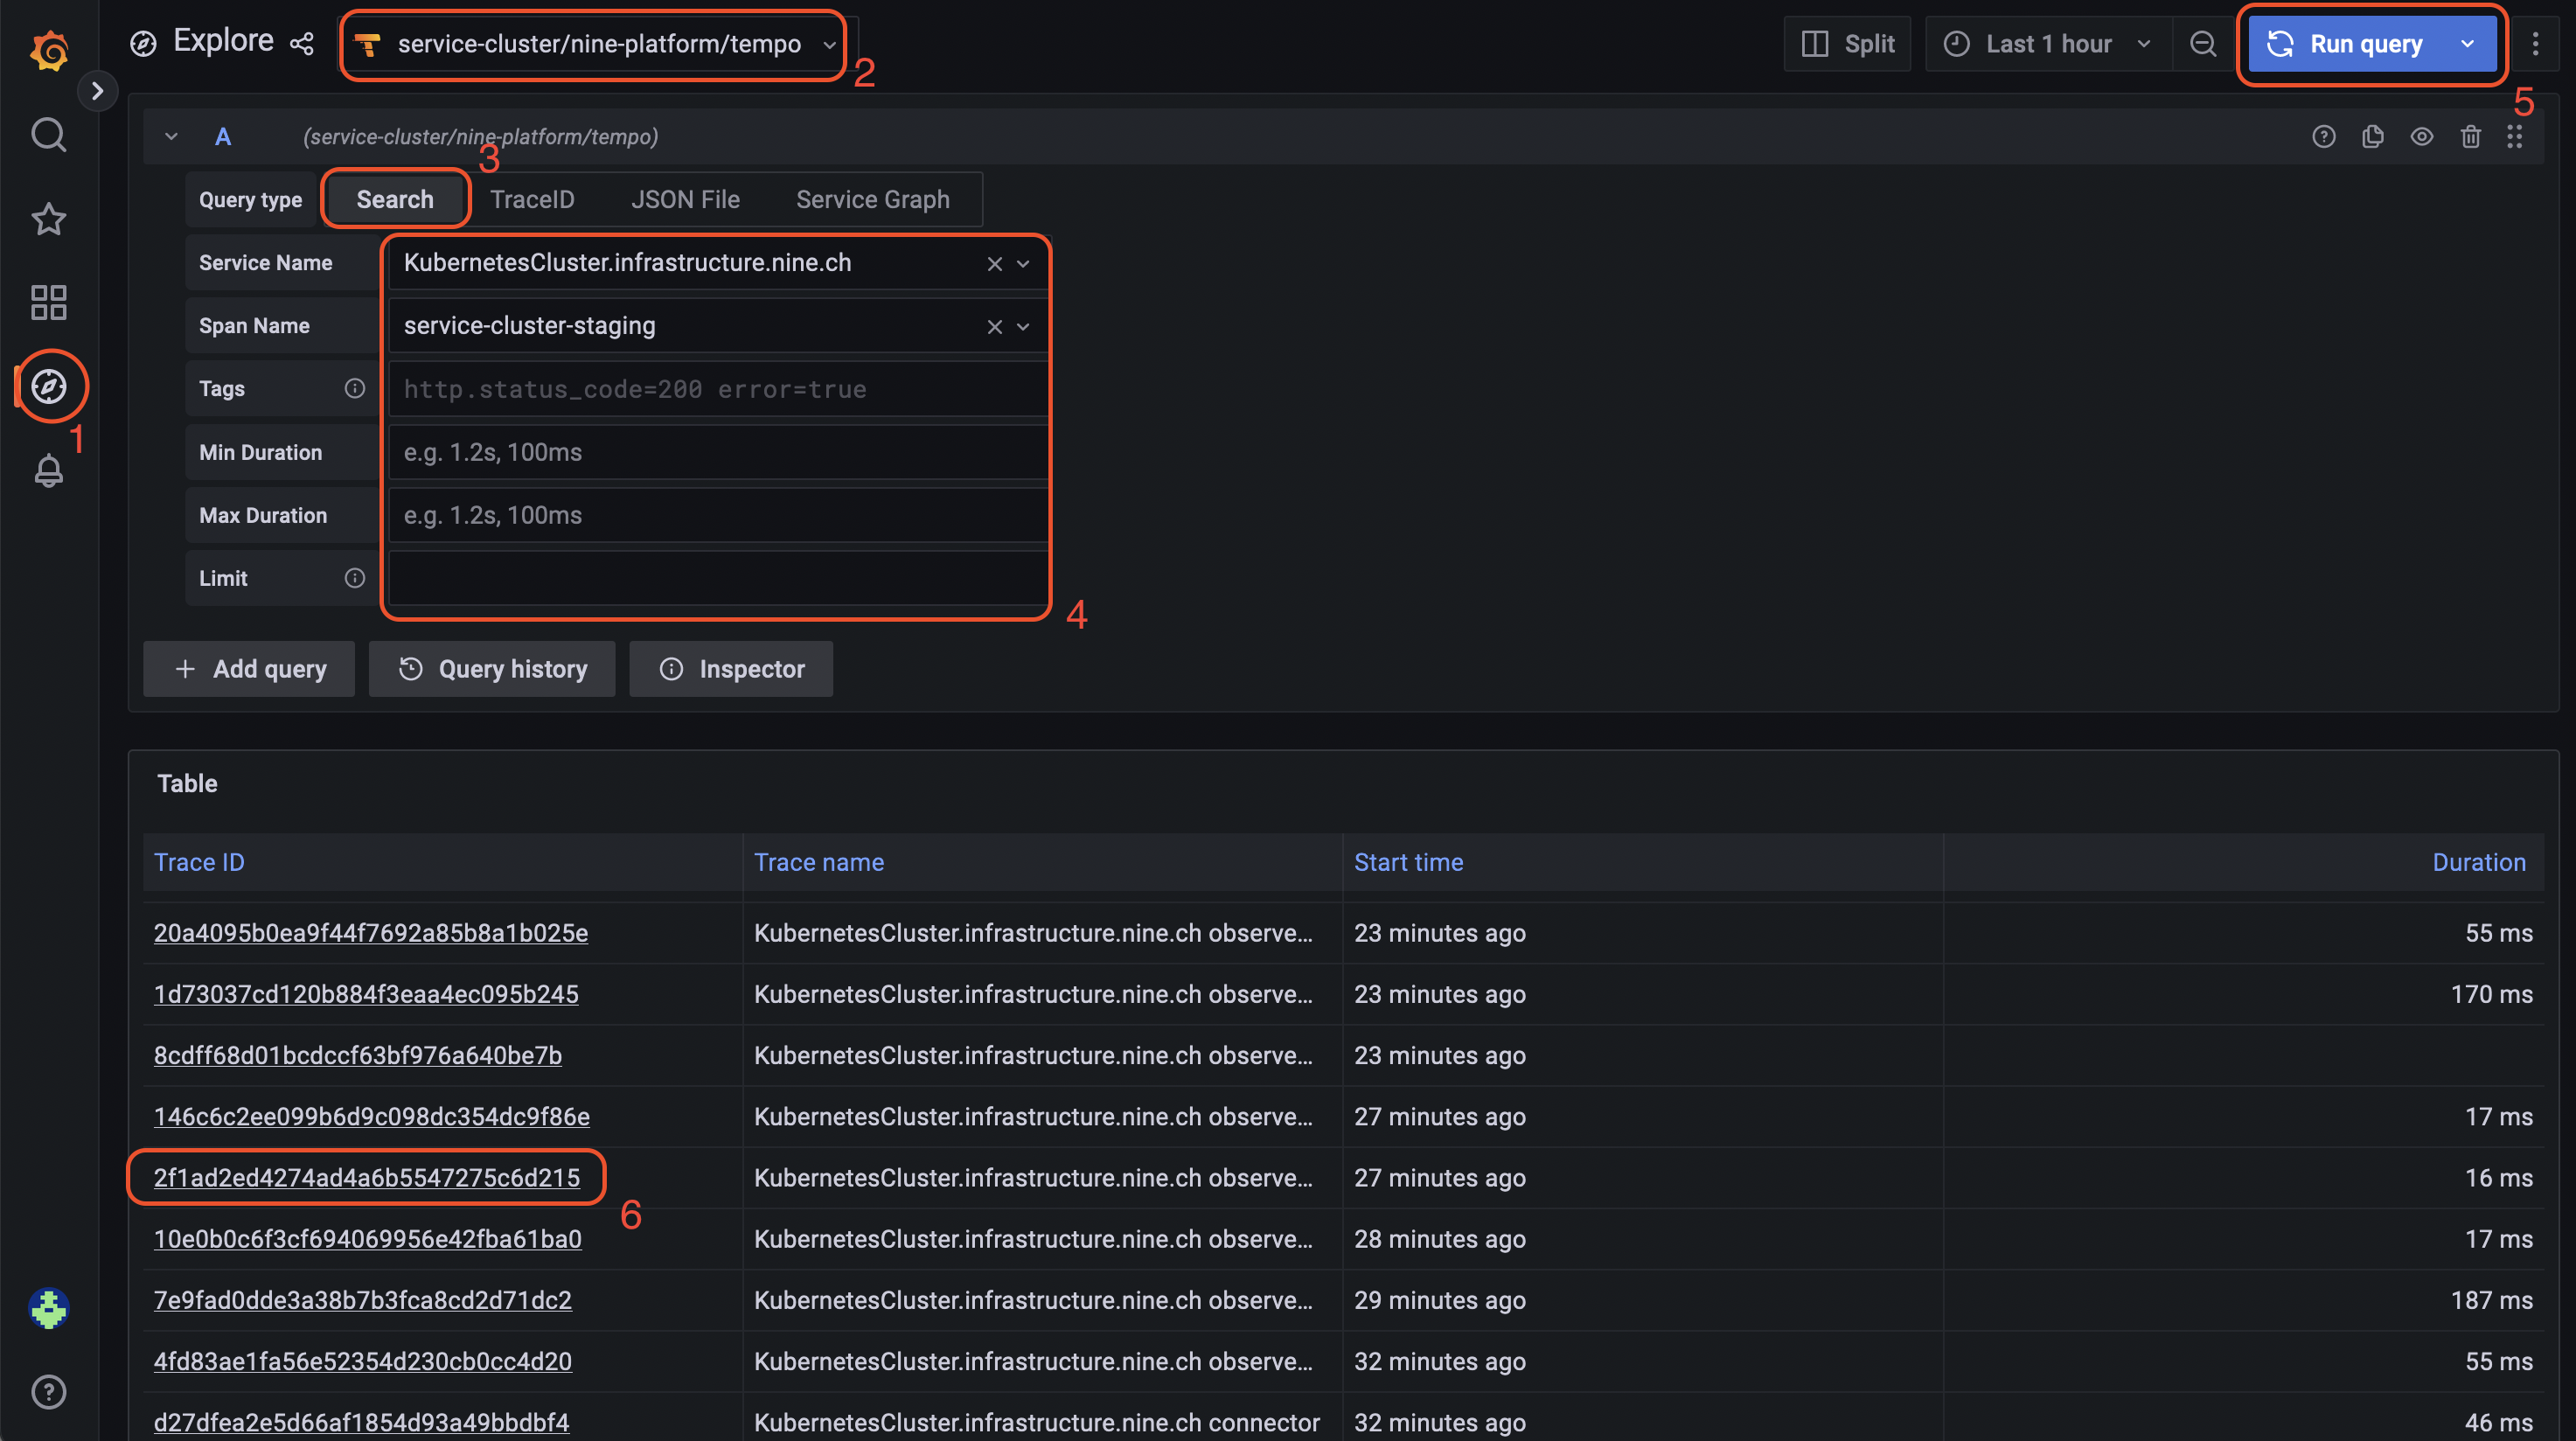
To view the sent traces in Grafana you will need to:
- Select the "explore" mode in the left navigation
- Select the Tempo data source at the top
- Select the "Search" query type
- Further select traces by filtering them with the available fields ("Service Name", "Span Name", etc)
- Click "Run Query" in the upper right corner
- Select a trace ID to display the full trace and all spans for it
