Grafana
Grafana allows you to quickly see the current state of your cluster and deployments.
Details
For customers who need to visualise the state of their NKE cluster, nine provides a default dashboard, built with Grafana.
You are also free to create your own dashboards, manage them in folders to create different hierarchies and add alerts to them.
Availability
Grafana is available as an optional service for NKE and it can be deployed using Cockpit.
Restrictions
Please note the following restrictions:
- Grafana Alerting: Grafana Alerting is currently not supported when using the metrics agent. Please use Alertmanager instead.
Usage
You can log in with your Cockpit account credentials.
Custom Dashboards and Alerts
To create your own dashboards, have a look at the official Grafana Documentation.
By default, Nine Managed Grafana comes with certain restrictions:
- Currently, it is not possible to add your own datasources.
- Editing the pre-deployed dashboards is not allowed, however, you can copy the JSON-definition of panels and use it in your own dashboard.
- It is not possible to configure alerts via email
- Alerts can only be defined on Dashboards & Panels that you have created
Some of these restrictions can be removed by enabling admin access.
Admin Access
We advise you to be careful with the admin permissions, as you could potentially break your Grafana instance. Nine reserves the right to remove admin permissions at any moment if the admin access is deemed a security or an operational risk.
Enabling admin access grants the Grafana Admin role to all users in your organization, replacing the default Editor role. This removes most of the default restrictions listed above and gives you full control over your Grafana instance, including the ability to add datasources and manage users.
- Cockpit
- nctl
Set EnableAdminAccess to true in the Grafana parameters in Cockpit.
Enable or disable admin access using nctl:
nctl update grafana <name> --admin-access
nctl update grafana <name> --no-admin-access
Local Users
By default, all Grafana login attempts are redirected to the nine.ch OIDC
provider. Once you have enabled admin access, you can create local Grafana users
via the built-in user management. To allow those local users to reach the login
form, enable AllowLocalUsers using nctl. Without this setting, local users
are immediately redirected to the OAuth login page and cannot sign in.
nctl update grafana <name> --local-users
nctl update grafana <name> --no-local-users
When AllowLocalUsers is enabled, OIDC users are no longer auto-redirected and
must manually click Sign in with OAuth on the login form.
Migration Guide for AngularJS-Based Panels
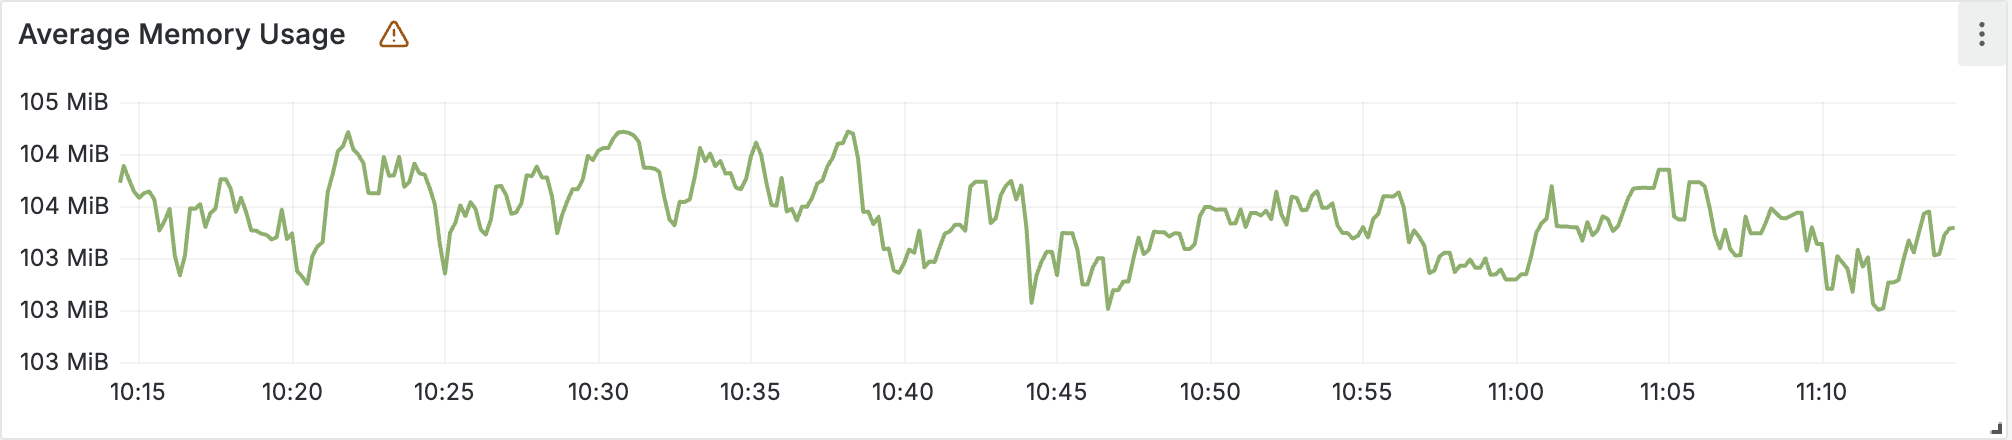
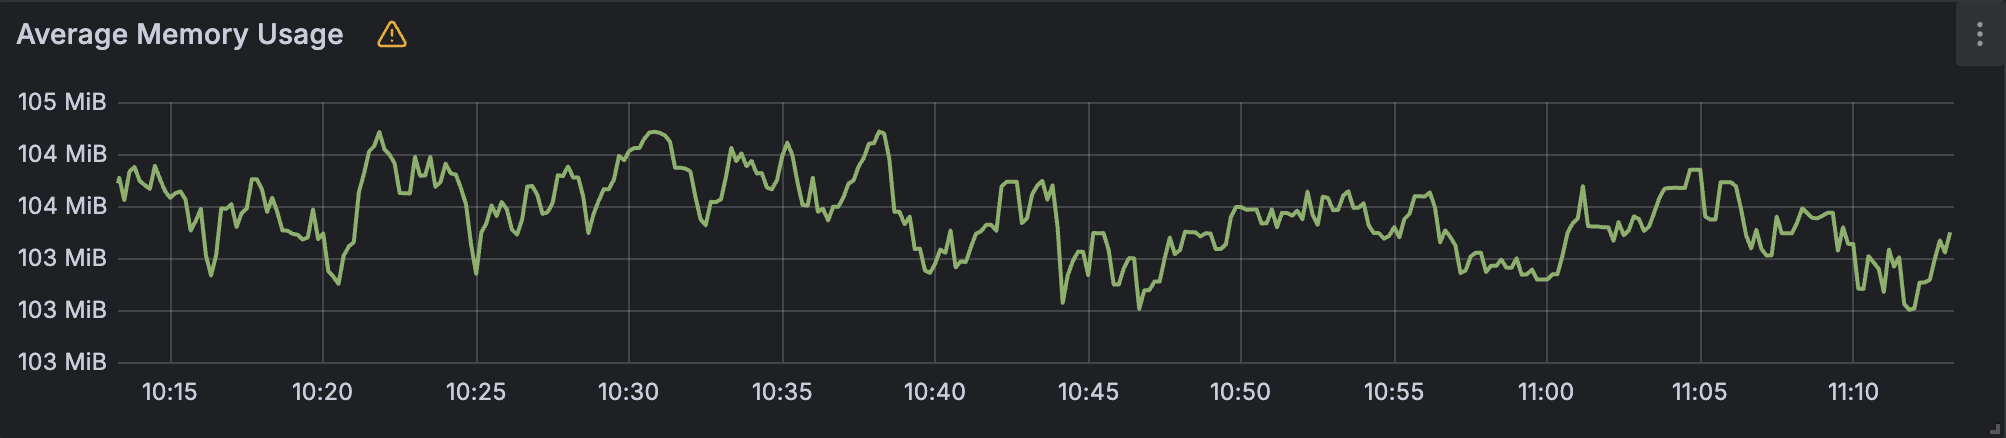
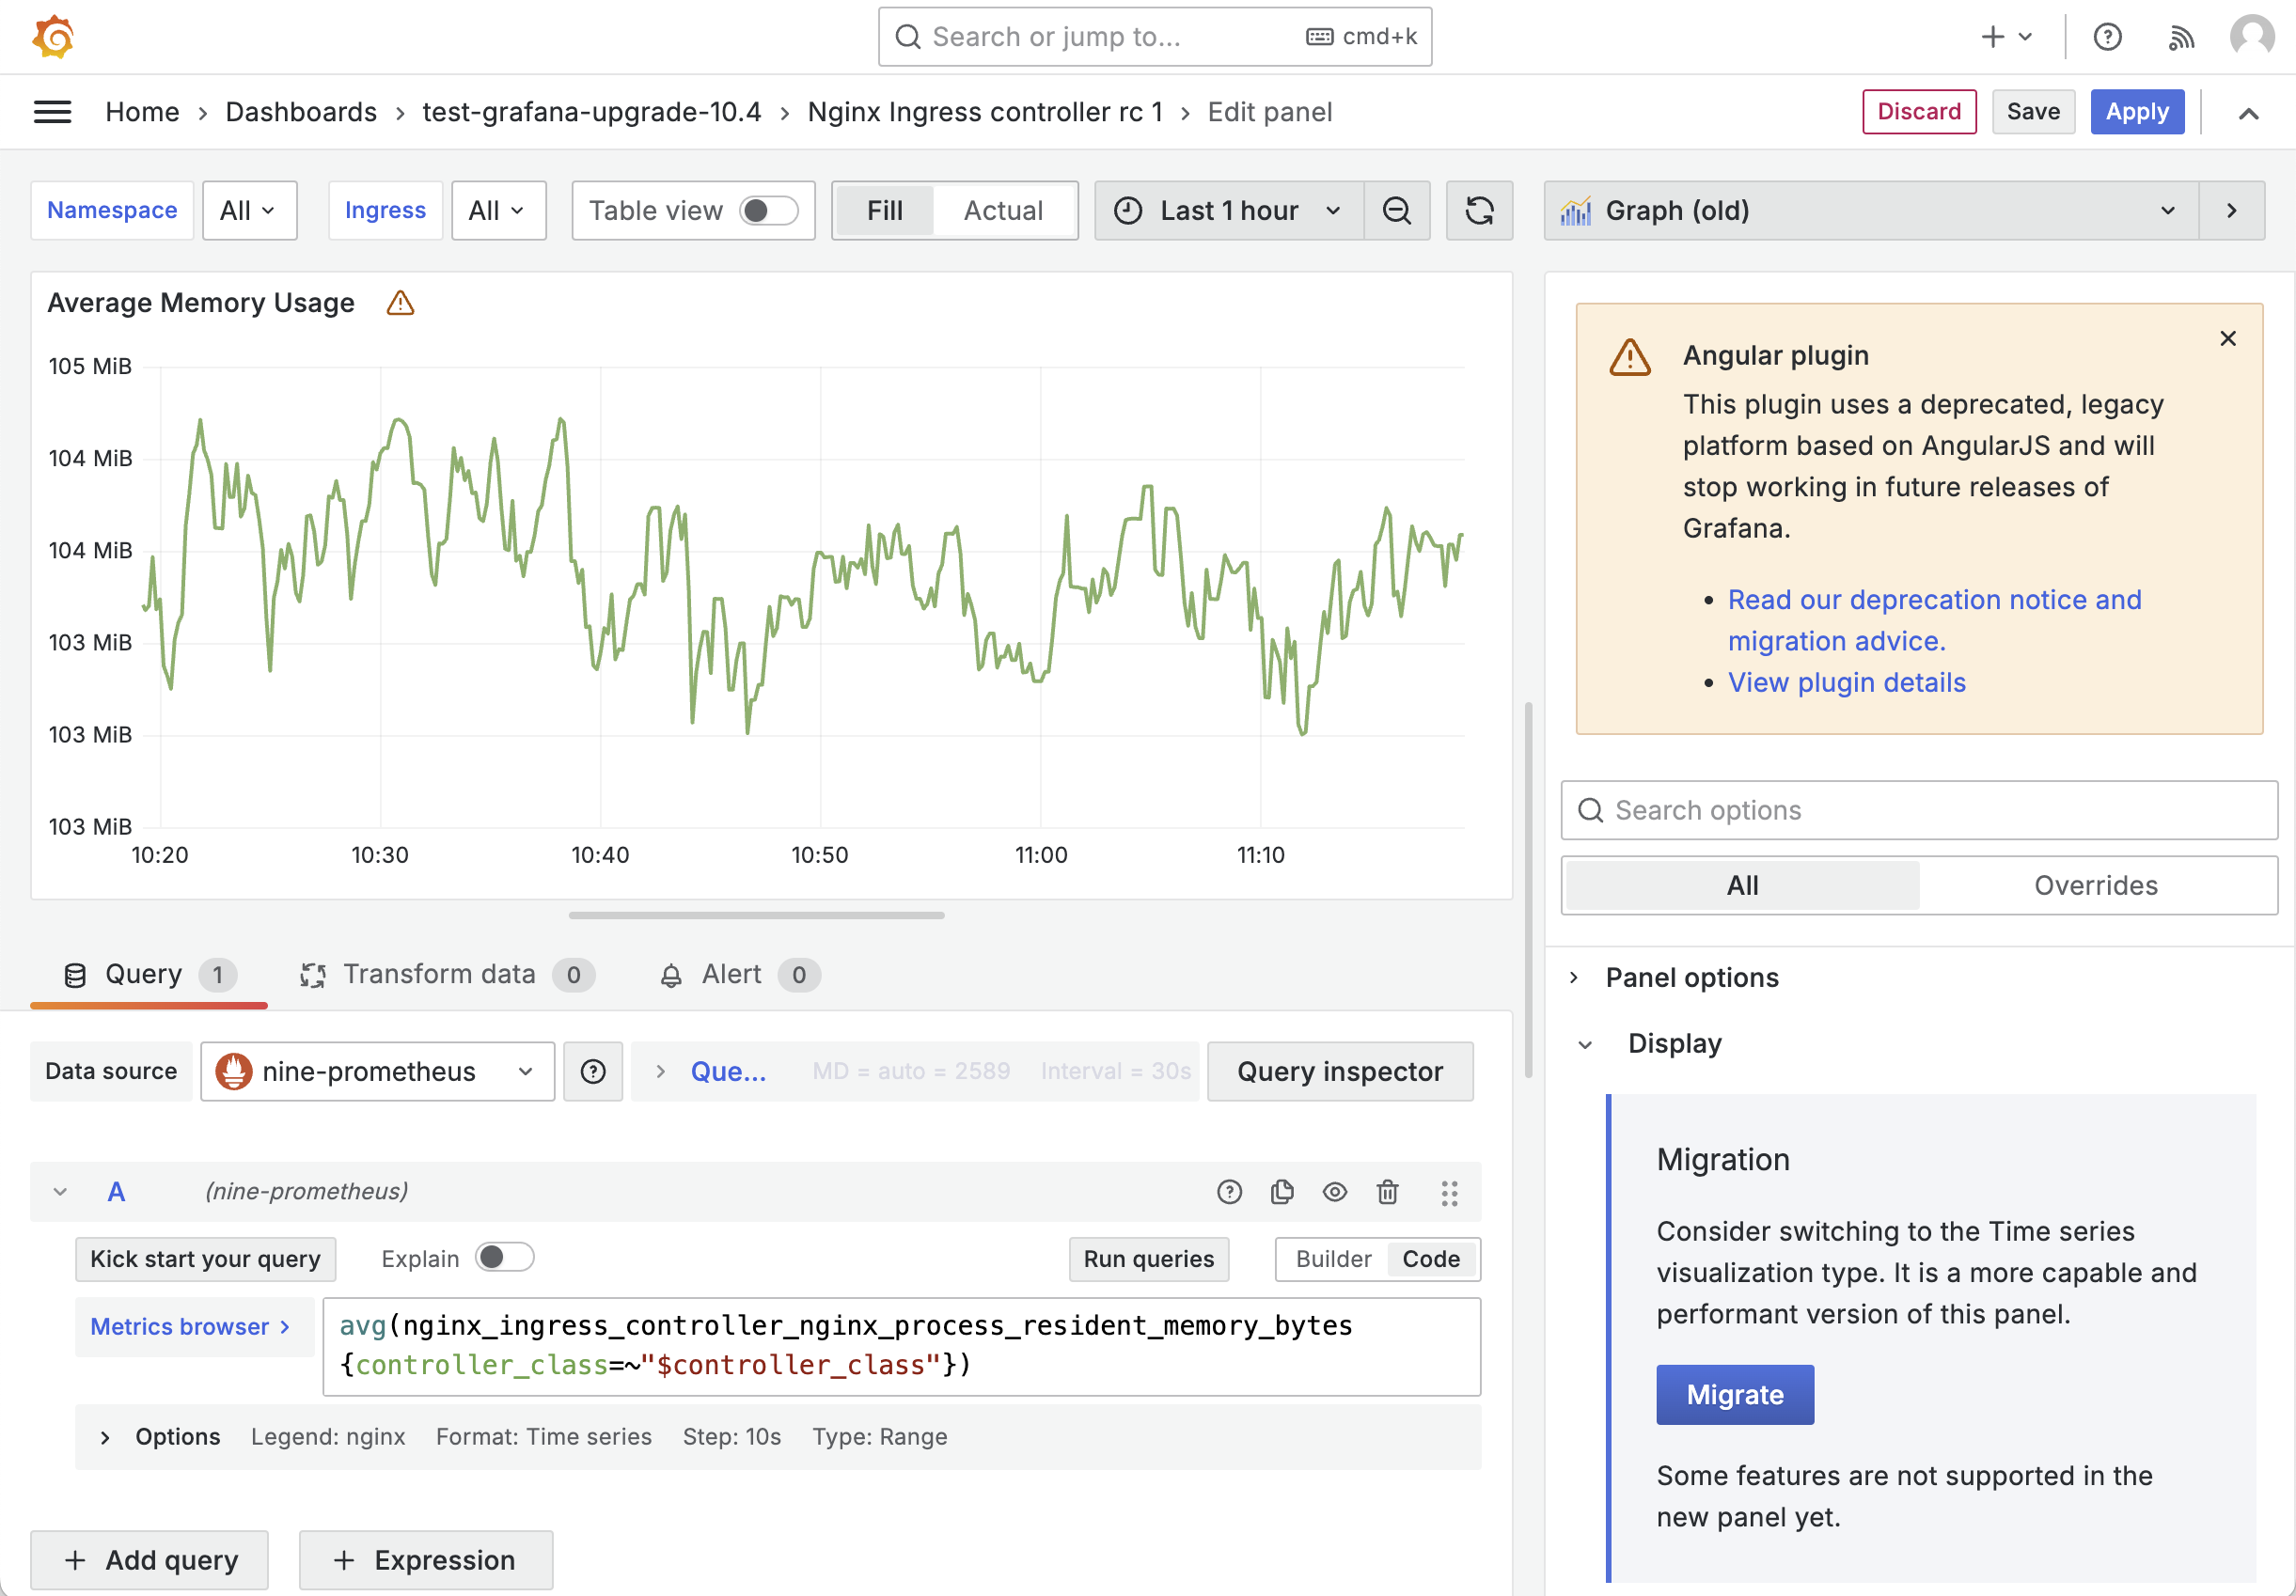
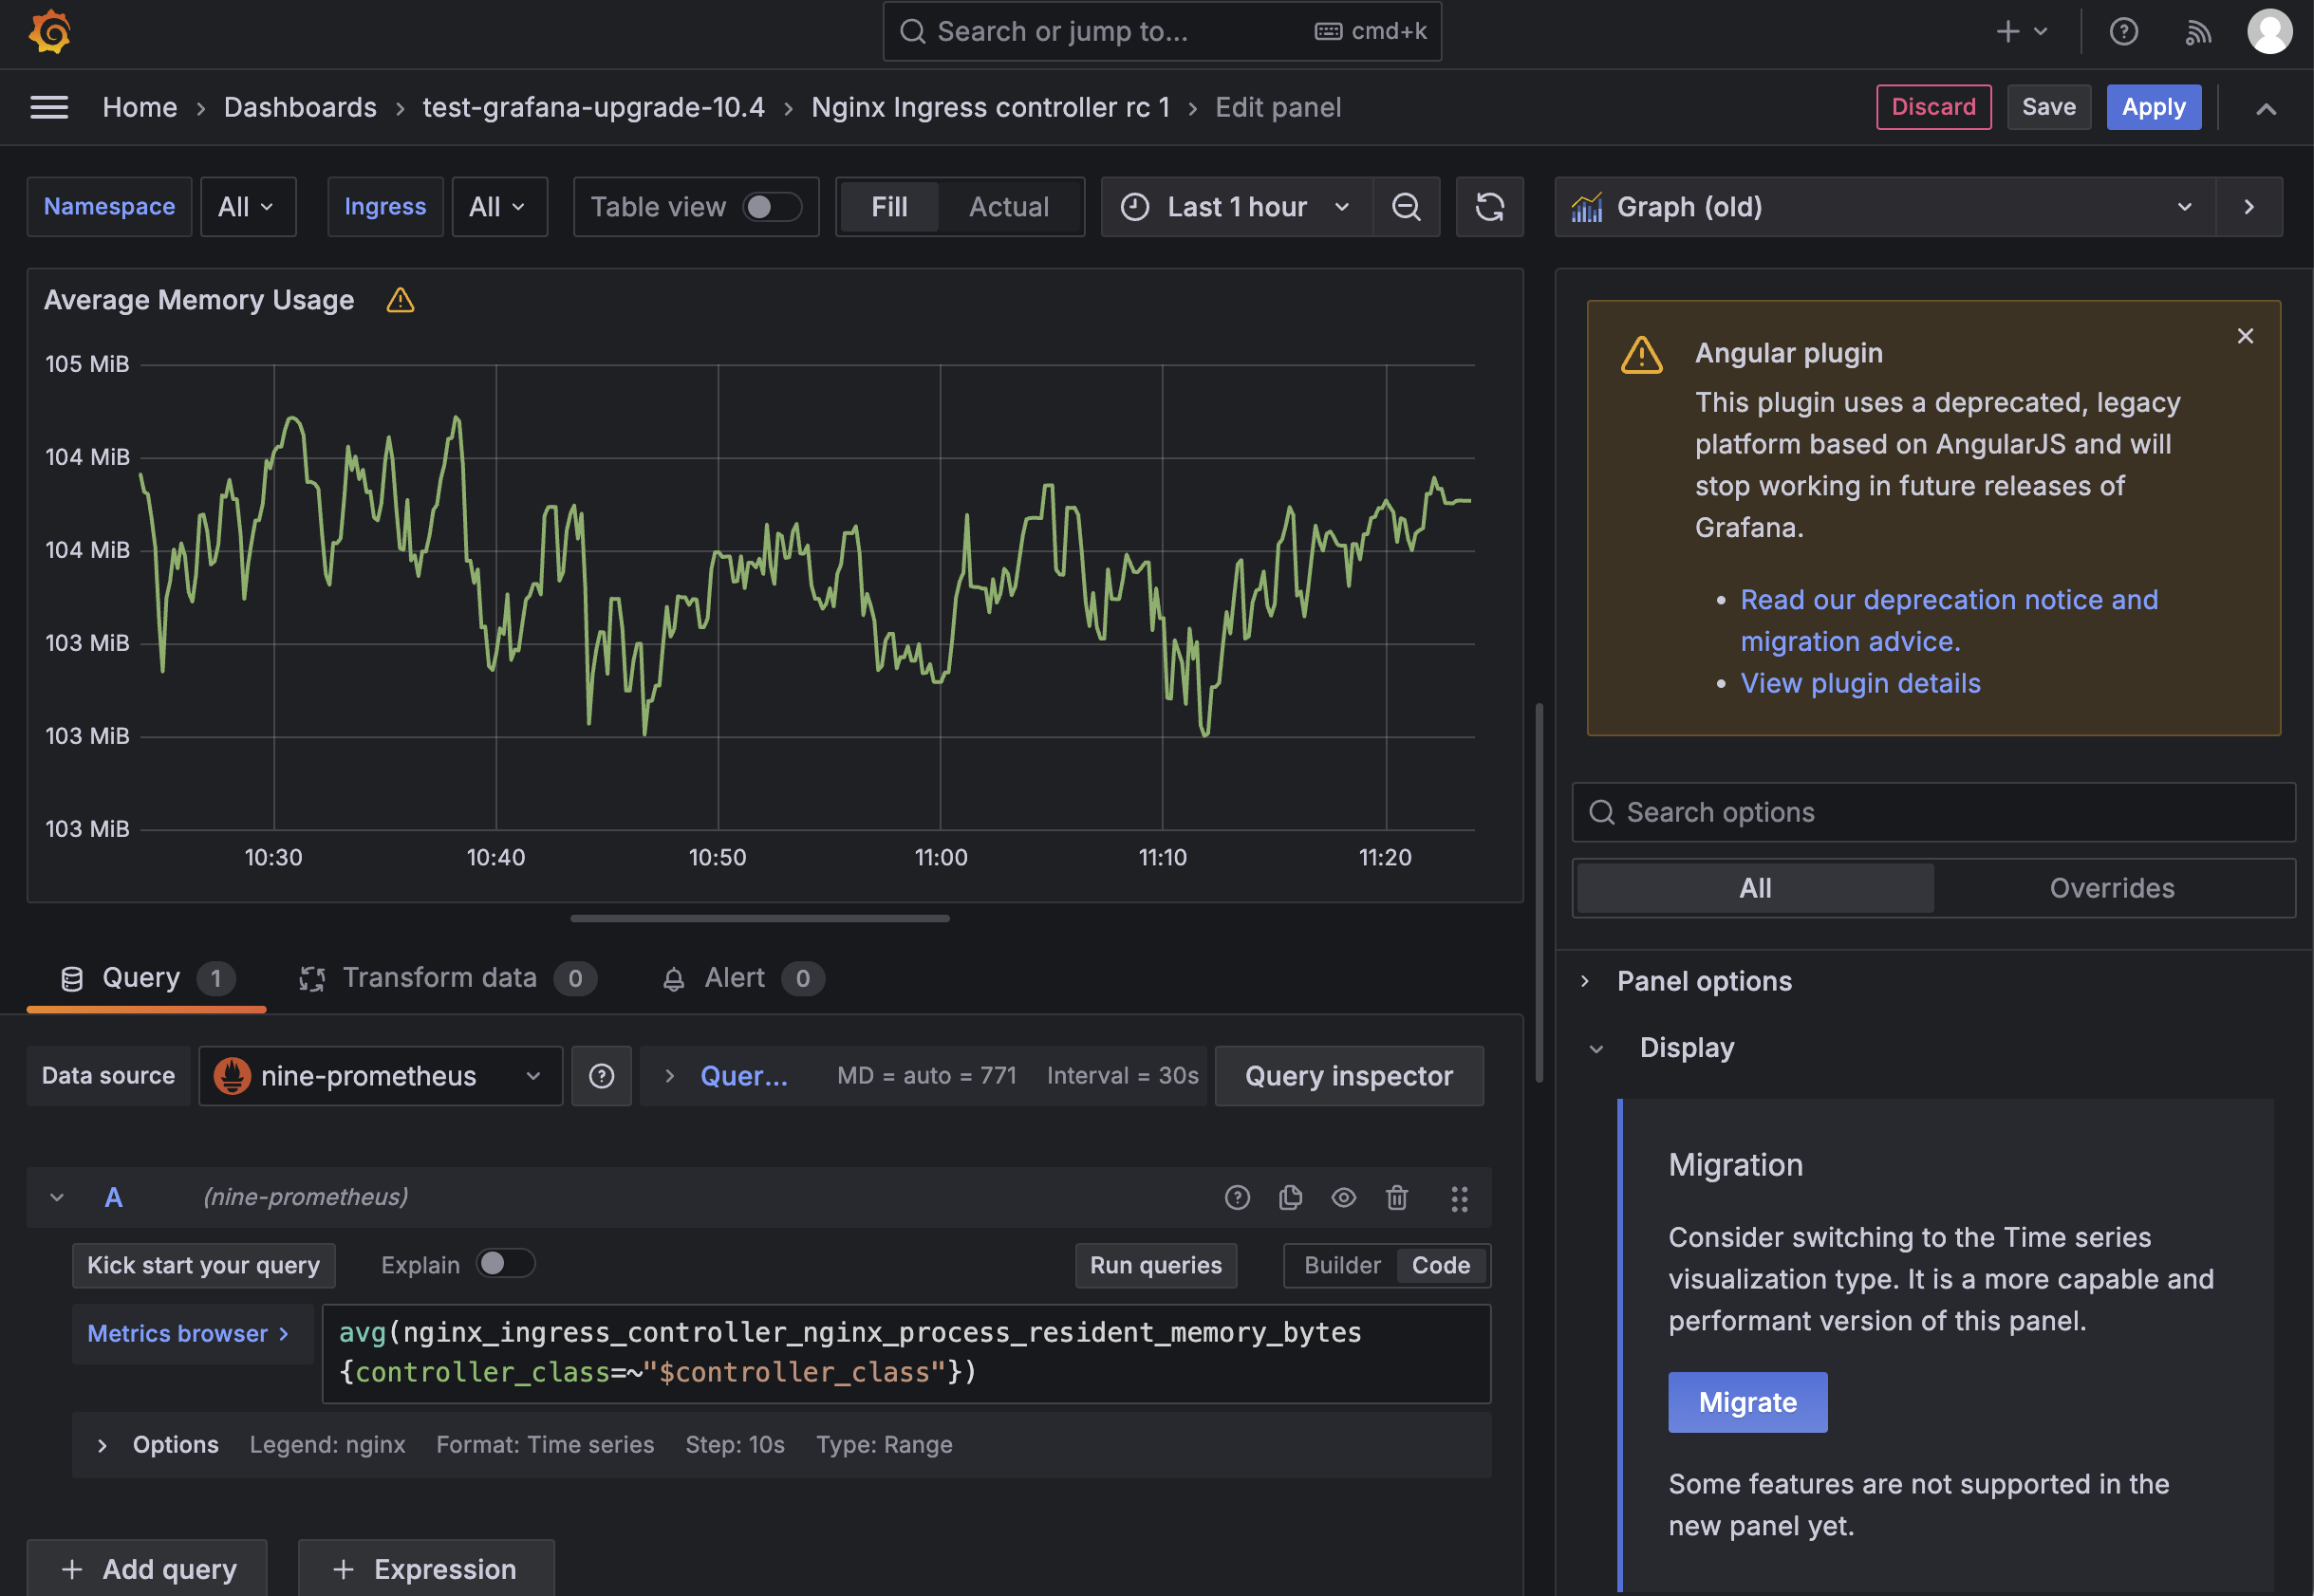
With the upcoming deprecation of AngularJS support in Grafana, it is essential to migrate all AngularJS-based panels to the supported frameworks to avoid future disruptions. Grafana 10.4 offers a Migration Wizard that makes this process straightforward. In your dashboard, AngularJS-based panels are flagged with an exclamation mark (!), helping you quickly identify the panels that require migration.
Simply open each identified panel in edit mode and follow the steps in the Migration Wizard to complete the conversion process.
Tips and Common Issues During Migration
Migration From Graph (old) to Time Series Panel
Problem: The graph is not visible, but some data can be seen by hovering mouse pointer over the render area. This means that while the data is present, it is not being properly displayed in the graph visualization.
Solution: This issue is often caused by incorrect or invalid threshold configurations.
To verify if this is the root cause, access the Dashboard Configuration (ensure
you have Edit mode enabled in the Dashboard settings), select the JSON Model
tab, and locate the relevant panel by searching for its name in the JSON data structure
source code. Check if each color setting (under thresholds) has a value
assigned (note that "value": "nil" is a valid entry). If any threshold configuration
is missing a value definition, for example, if the configuration for red is
invalid, simply remove the red object from steps to resolve the issue:
...
{
  "fieldConfig": {
    "defaults": {
      "custom": {...},
      "thresholds": {
        "mode": "absolute",
        "steps": [
          {
            "color": "transparent",
            "value": null
          },
          {
            "color": "red"
          }
        ]
      },
      "unit": "none"
    },
    "overrides": [...]
  },
  "gridPos": {...},
  "options": {...},
  "pluginVersion": "10.4.7",
  "targets": [...],
  "title": "Average CPU Usage",
  "type": "timeseries"
},
...
Once you remove this invalid step, the graph should render correctly.
Afterward, you can redefine the threshold settings, such as specifying the red
configuration again, but ensure to use an updated format to prevent the initial
rendering problem from recurring.
Migration From Table (old) to Table Panel
Problem: After migrating, some columns may be missing, or there could be changes to data types, formatting, or threshold configurations.
Solution: These issues often stem from Overrides configurations. Follow these
steps, which may resolve the issue:
- Change Field Overrides. In the panel properties, tab
Overrides, update theFields with namesetting to a selectable option from the dropdown list (e.g.,Time). If it changes to something likeTime (not found), use the dropdown again and select an appropriate field (for exampleField). - Edit
Display NameandUnits. Navigate to the relevant text box forChange the field or series nameand manually input the correct name. Similarly, in theUnittext box, experiment with available types — for instance, try selectingMisc > String. - Correct additional columns. Repeat the process for the remaining columns as needed.
For instance, for the second column, set the
Fields with nameoption toLast *and make sure you select the correct name and unit. This should help resolve formatting issues and ensure the threshold display renders colors correctly.